The VACCINATED are at substantial risk of COVID infection post vaccine; how the UK data helps us understand the dynamics especially during the OMICRON era; OMI adds fuel to the fire
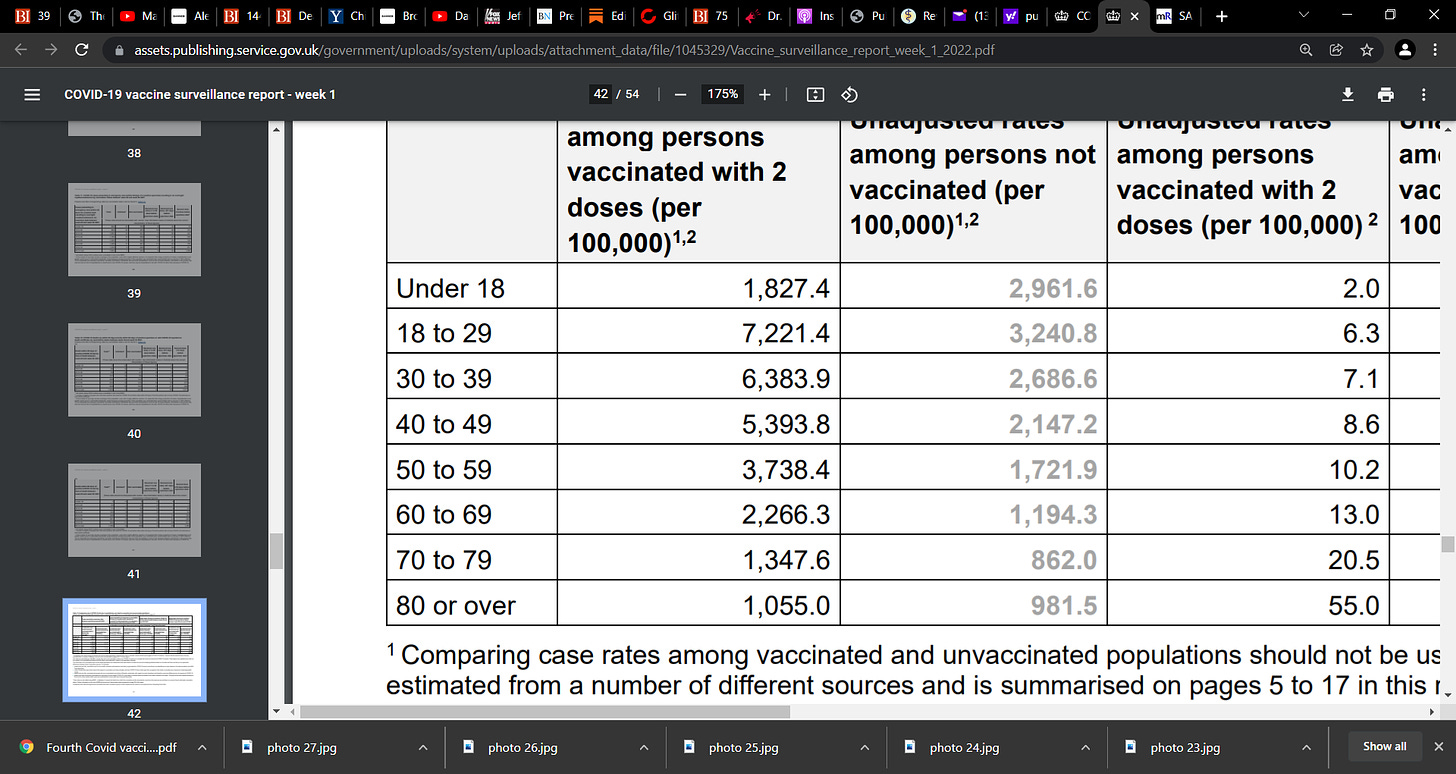
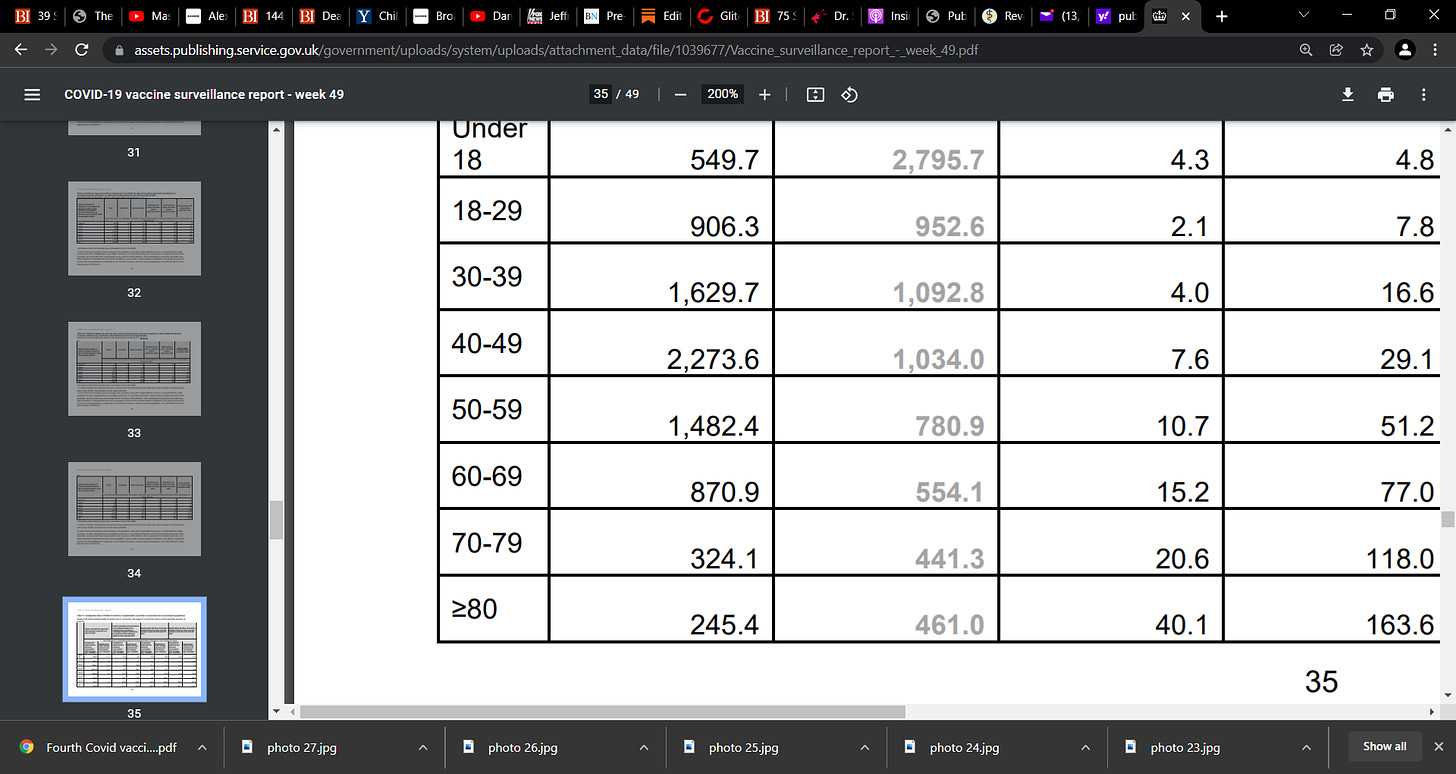
The key chart to focus on is the end of 2021 and beginning 2022 (1st chart) so OMICROM was in bloom, most updated data; can you see how infections explode across age-groups from prior weeks?
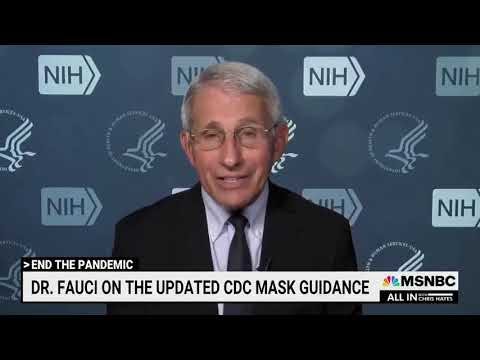
Start with this 30 second from Fauci…so much said and we lose track, this is important as Omicron is many times more infectious than the Delta…you can imagine the massive viral load in the post-vaccinated person infected with Omicron:
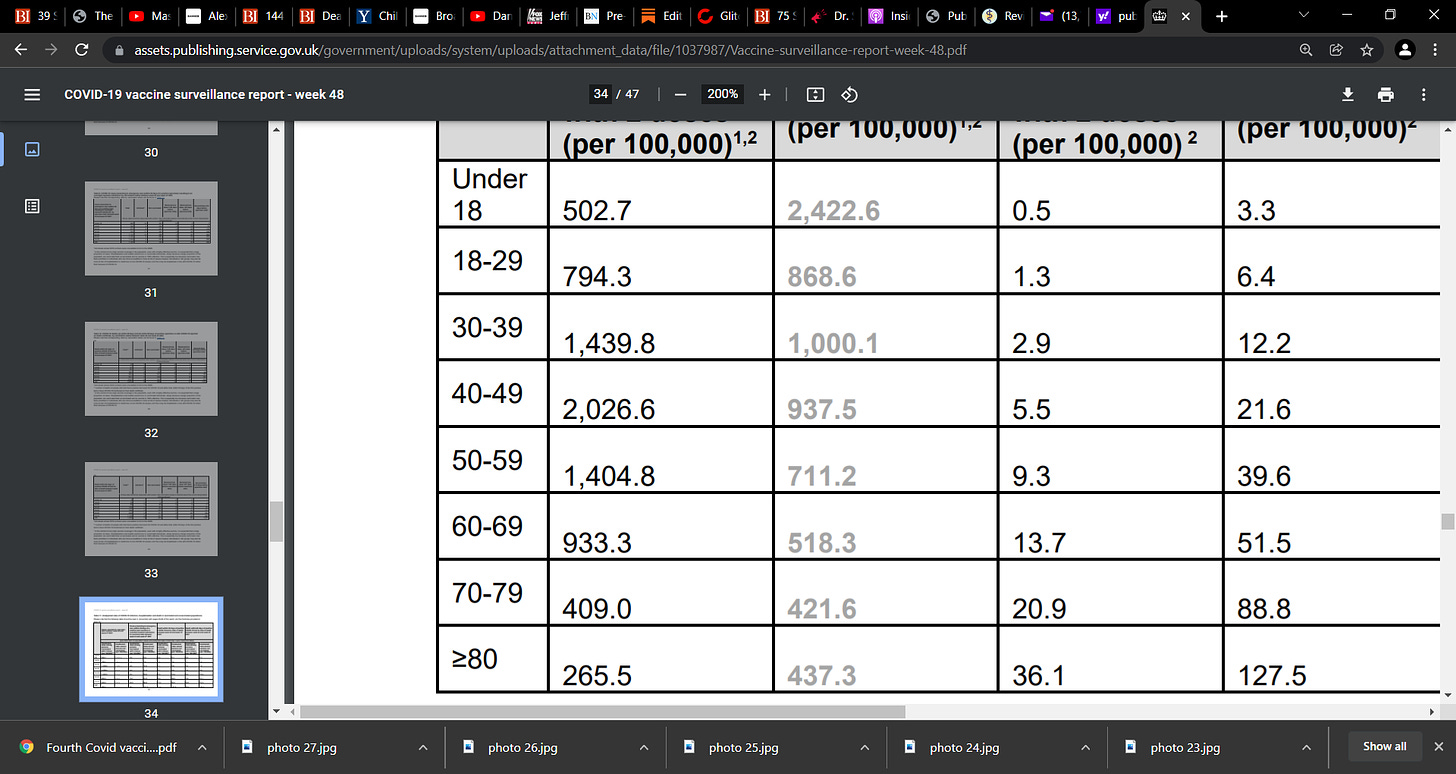
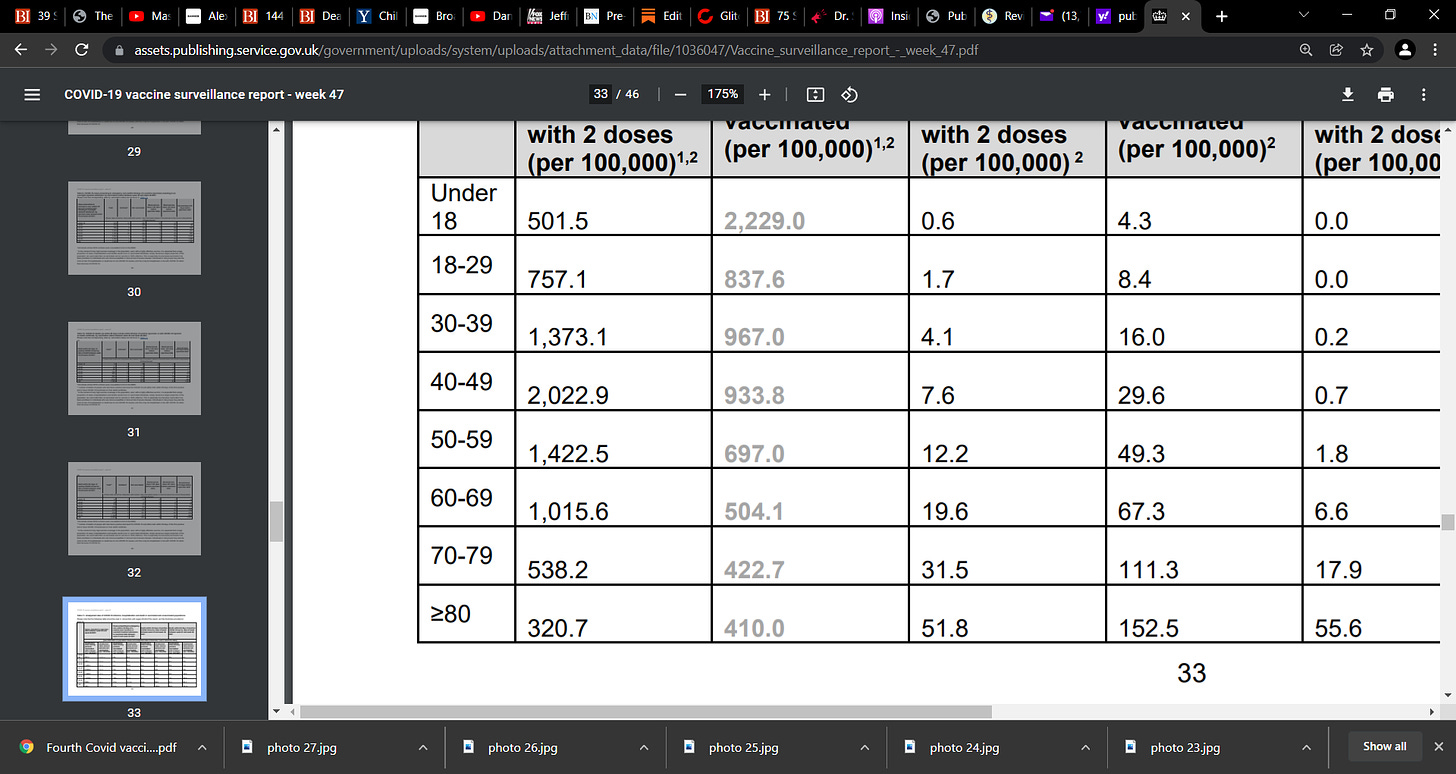
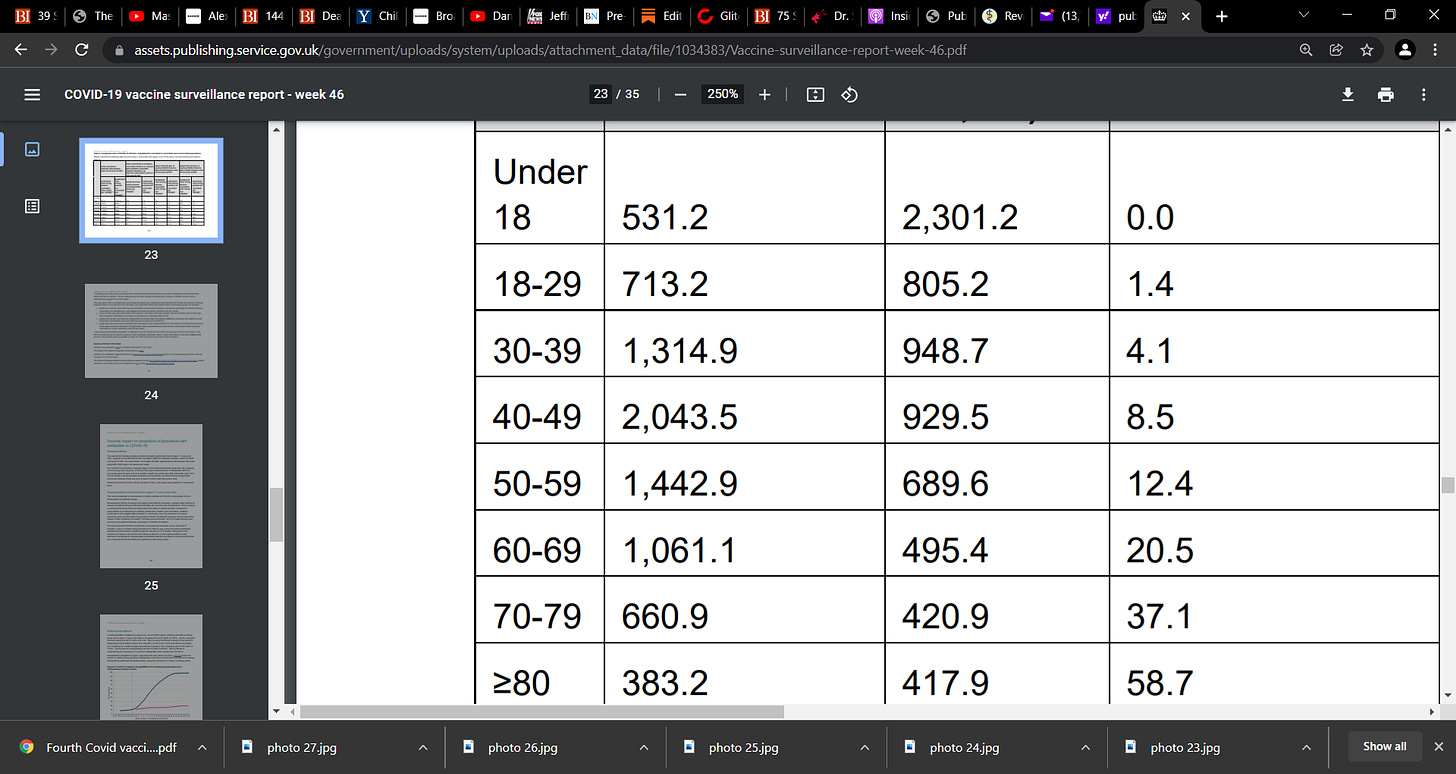
You can actually see in the data that as Omicron set in late Nov to Dec to now (2022), how the infections exploded across all ages and even in <18….a combination of vaccination and OMICRON…
I am arguing you have a combination of the wrong vaccinal antibodies given Wuhan is long gone and it is Delta and Omicron predominant, so there is massive immune escape, but also, it may well be that the initial exposure was to vaccine (1st shot) and this drove a systemic response of B-cells and antibodies (dumped into the circulation); while vaccinated, given there is massive infectious pressure with Omicron etc., you will be no doubt exposed to pathogen in the respiratory tract and the problem is that the immune system is primed (prejudiced) to produce antibodies and you may have well caused your immune system to respond with systemic antibodies again while what is needed is a cytotoxic cellular response at the respiratory site to clear out infection. You are being routinely exposed give virus is all around and your immune system is continuously responding wrong, with B cells sending antibodies systemically and not cytotoxic cells locally (Th 1) in the respiratory tract (upper etc.); you are getting more and more infected as no cytotoxic response to clear out infection and this is potentially why the vaccinated is getting so massively infected. They are then at risk of transmitting virus. We have seen this in studies.
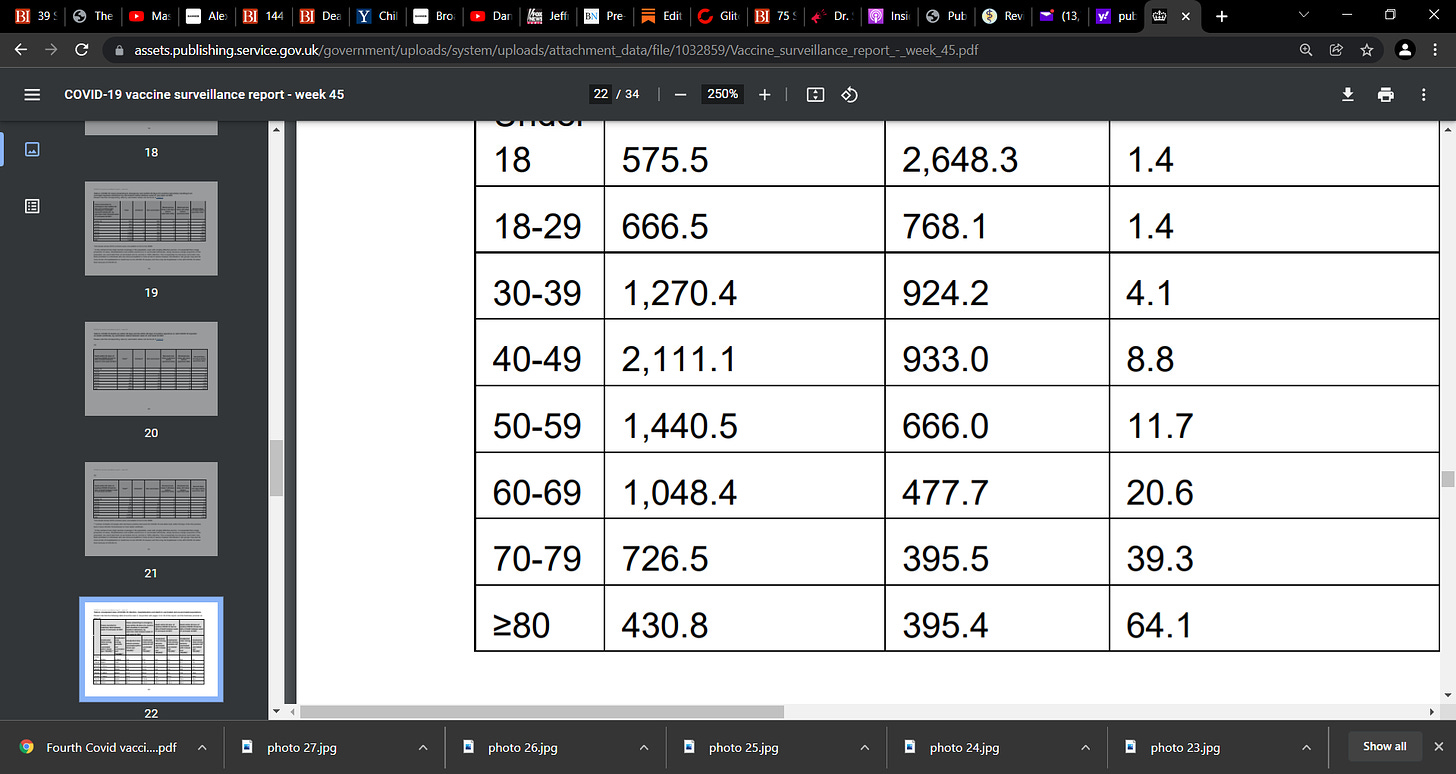
Some experts may argue that the most recent UK table (the first one here) data can be explained this way:
1) the lower rates in the vaccinated < 18 (relative to non-vaccinated) reflects resistance to the Delta/Omicron variant spike protein given Wuhan is in the vaccine and has not predominated for a while now; this may mean that the innate immune antibodies are not out-competed (suppressed) by the highly specific vaccinal antibodies (vaccinal antibodies will outcompete/suppress non-specific innate antibodies) given there is spike resistance to the antibodies, and thus the innate antibodies are now ‘set free’ and can now function optimally to defend against infection
2) the lower rates in the unvaccinated may actually provide protection to the larger society; it may represent ‘training’ or ‘learning’ across time, and in older sub populations due to repeated exposure; the idea is that when in the efficacy lab setting, there is a purer control ‘unvaccinated’ group not excessively exposed; but in mass vaccination, this control is not longer a placebo, the exposure dynamics changes for now the ‘control group’ or ‘placebo’ is no longer a classic placebo as now exposed in the environment as the vaccine program unfolds; they may be unvaccinated but exposed and as such their immune system is being trained and tuned and taxed and developing some level of learning and as such, are better able to stave off infection; in other words the unvaccinated are in a better position than the vaccinated that is trying to mount an immune response while there is infectious pressure; the immune response will be sub-optimal and hobbled; while the pressure on the virus drives natural selection of variants, there is also immune escape and the vaccinated become infected as their immune response is still immature and not fully developed while mounting.
One can also argue that the unvaccinated having such lower rates is because they have some level of natural immunity.
We are trying to understand what is happening here and so pardon my reflections; we do know the vaccine has a role in driving infection in the vaccinated and this UK data, the Israeli data, and in fact all of the globe’s data show us this.
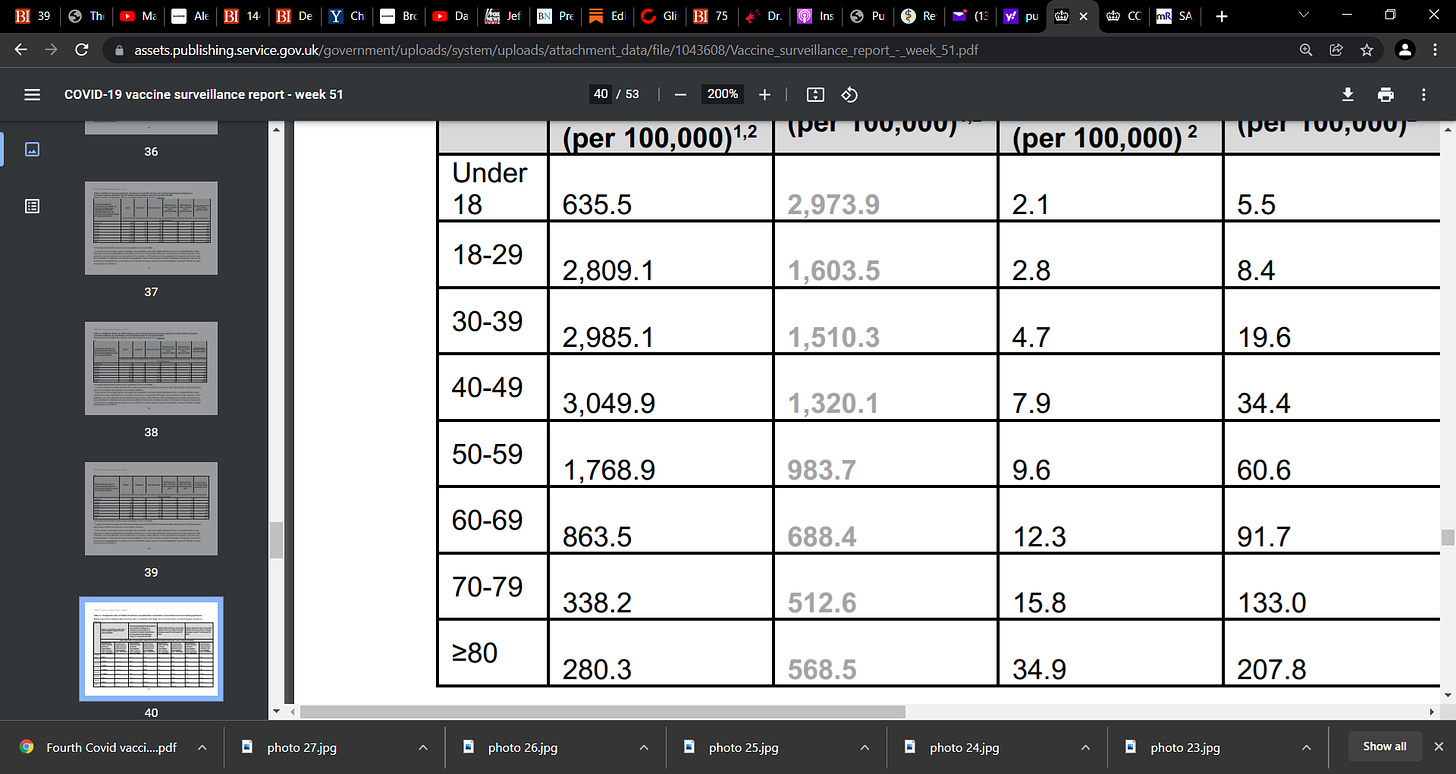
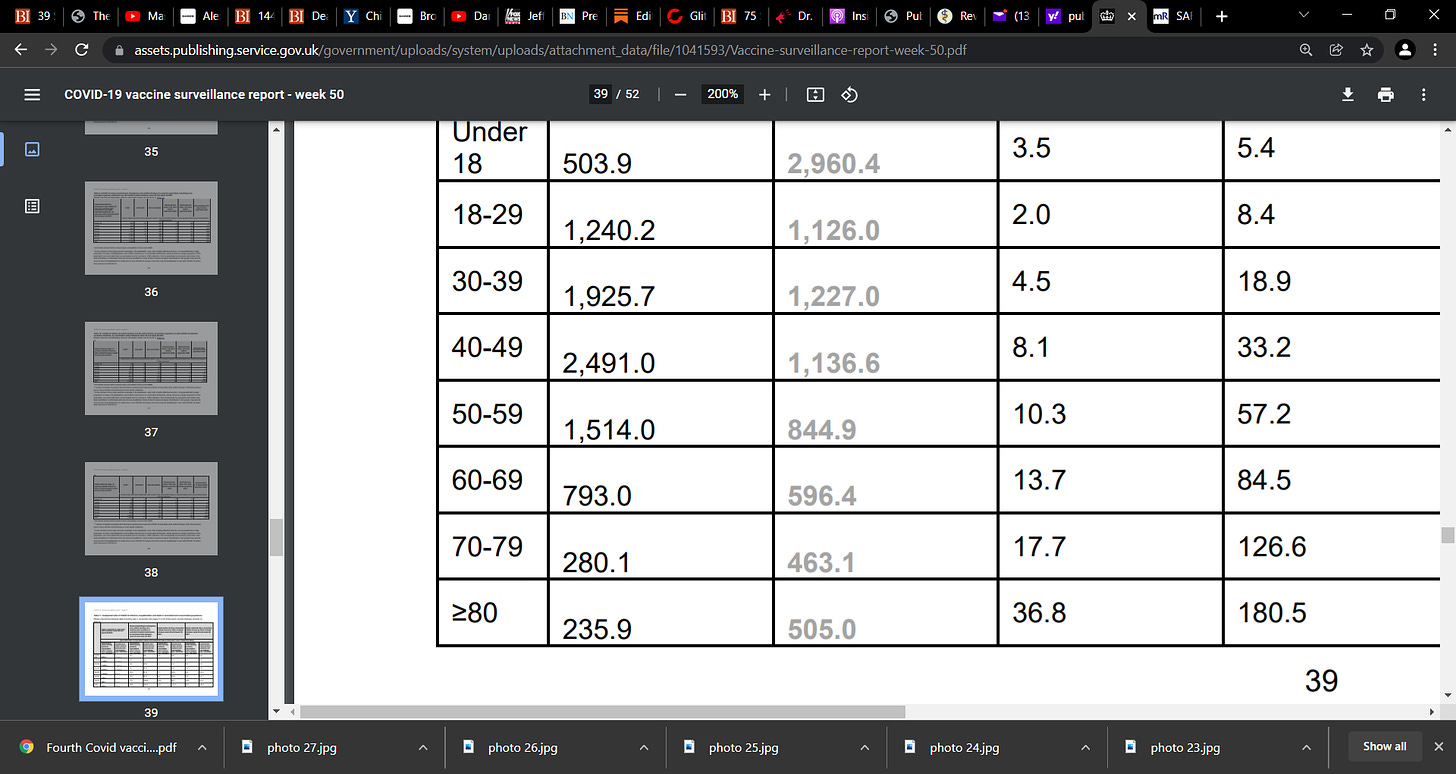
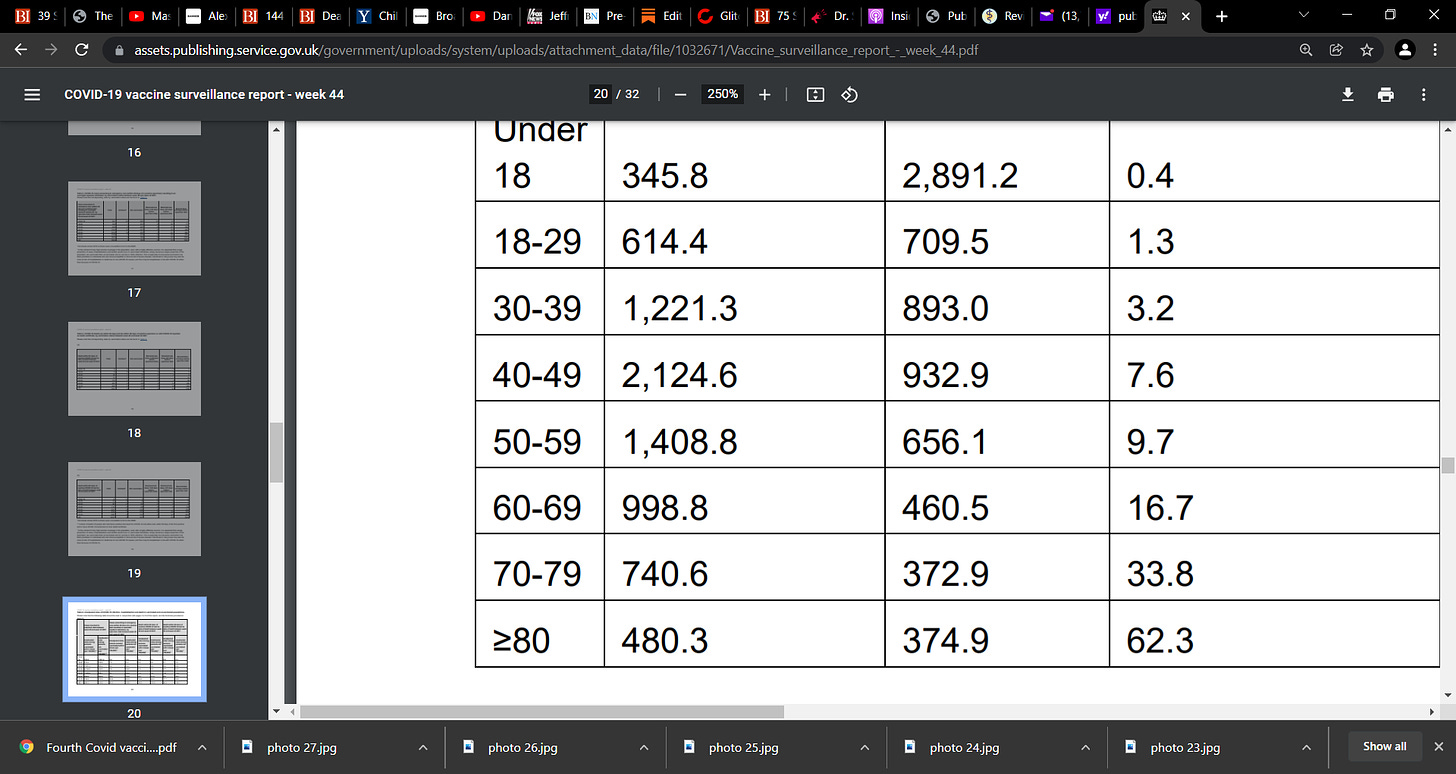
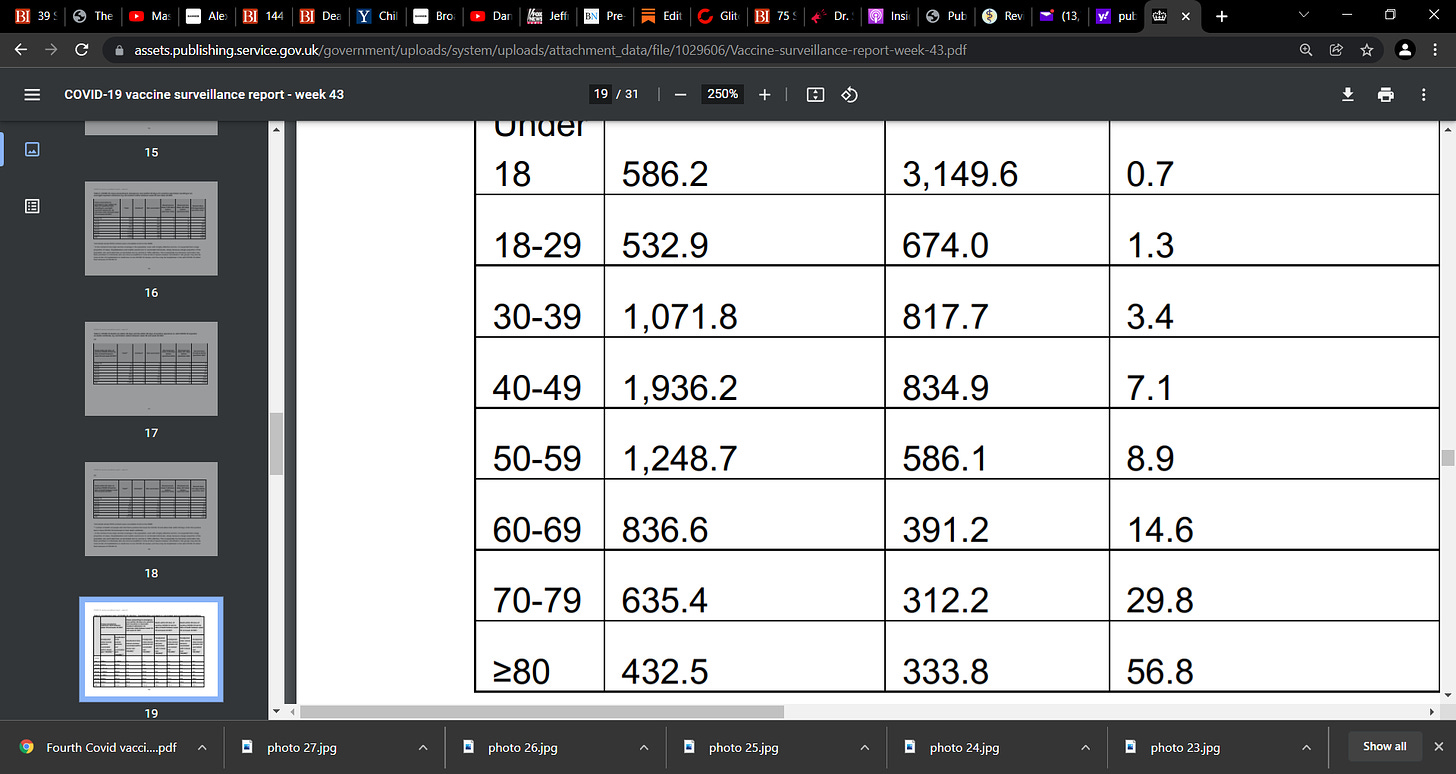
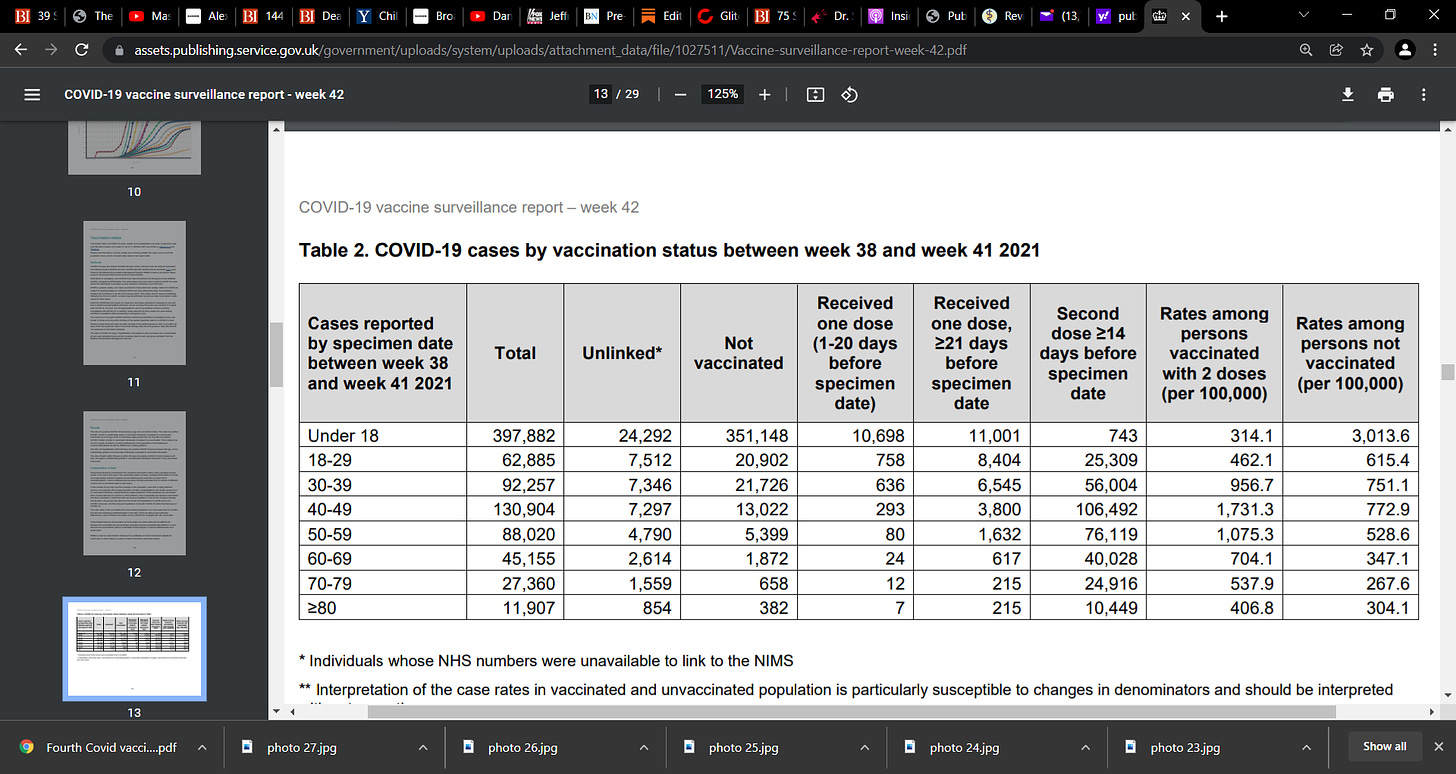
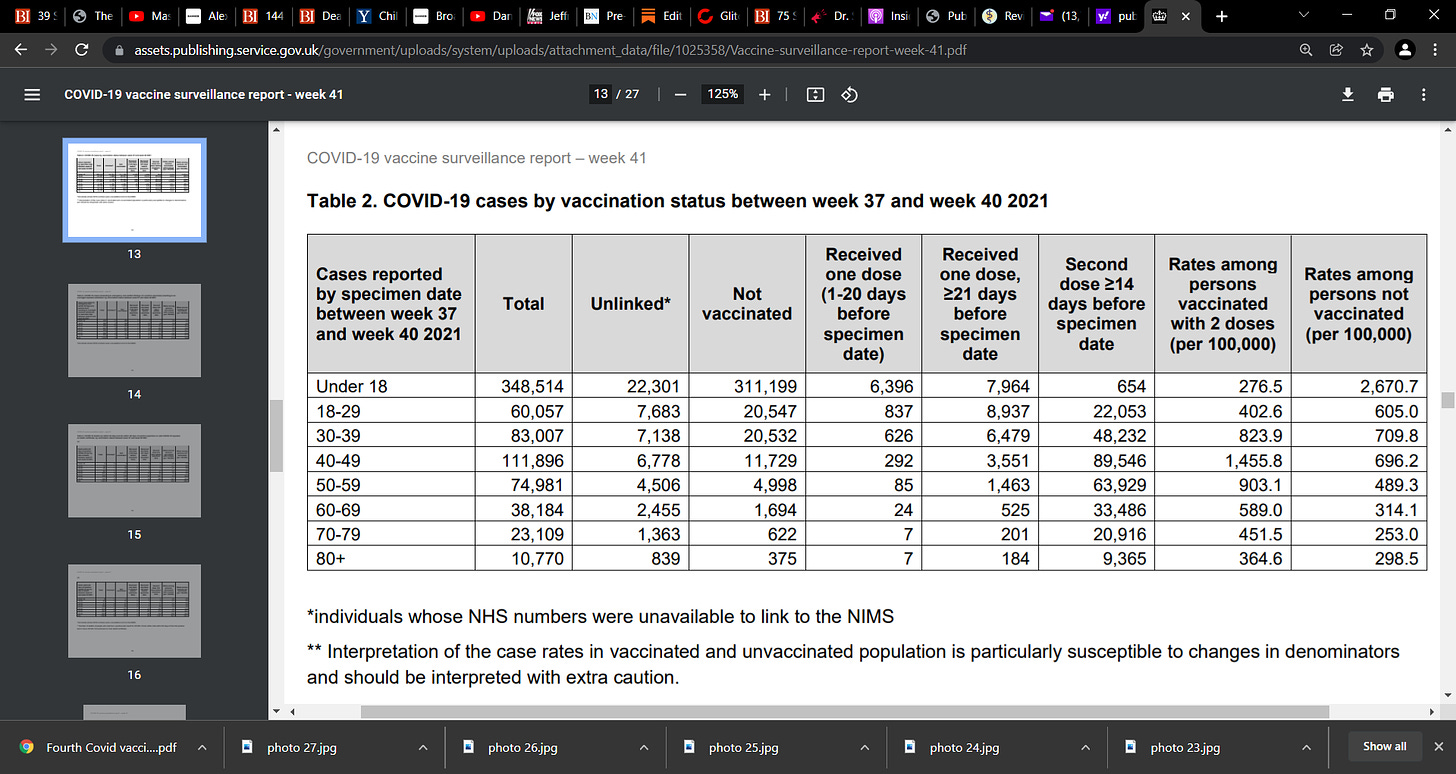
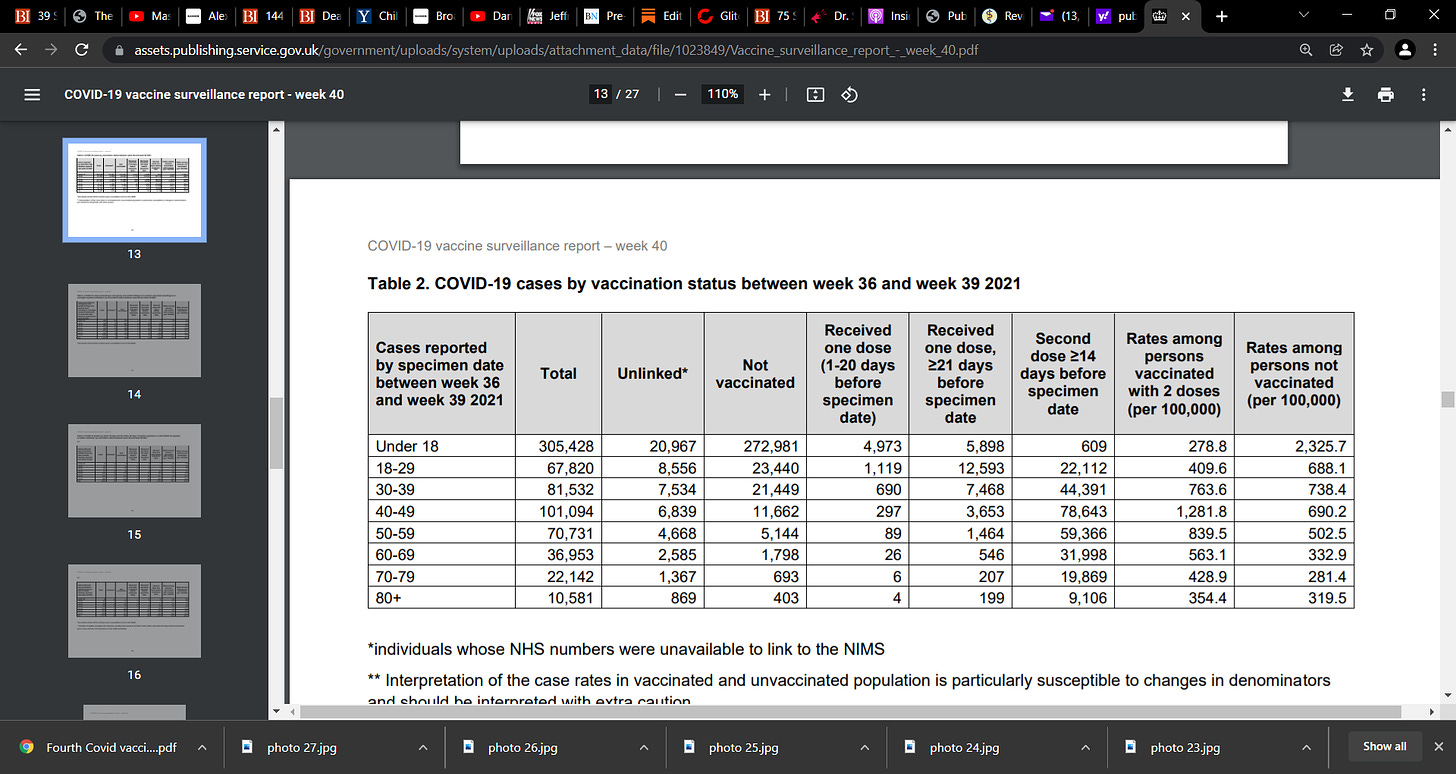
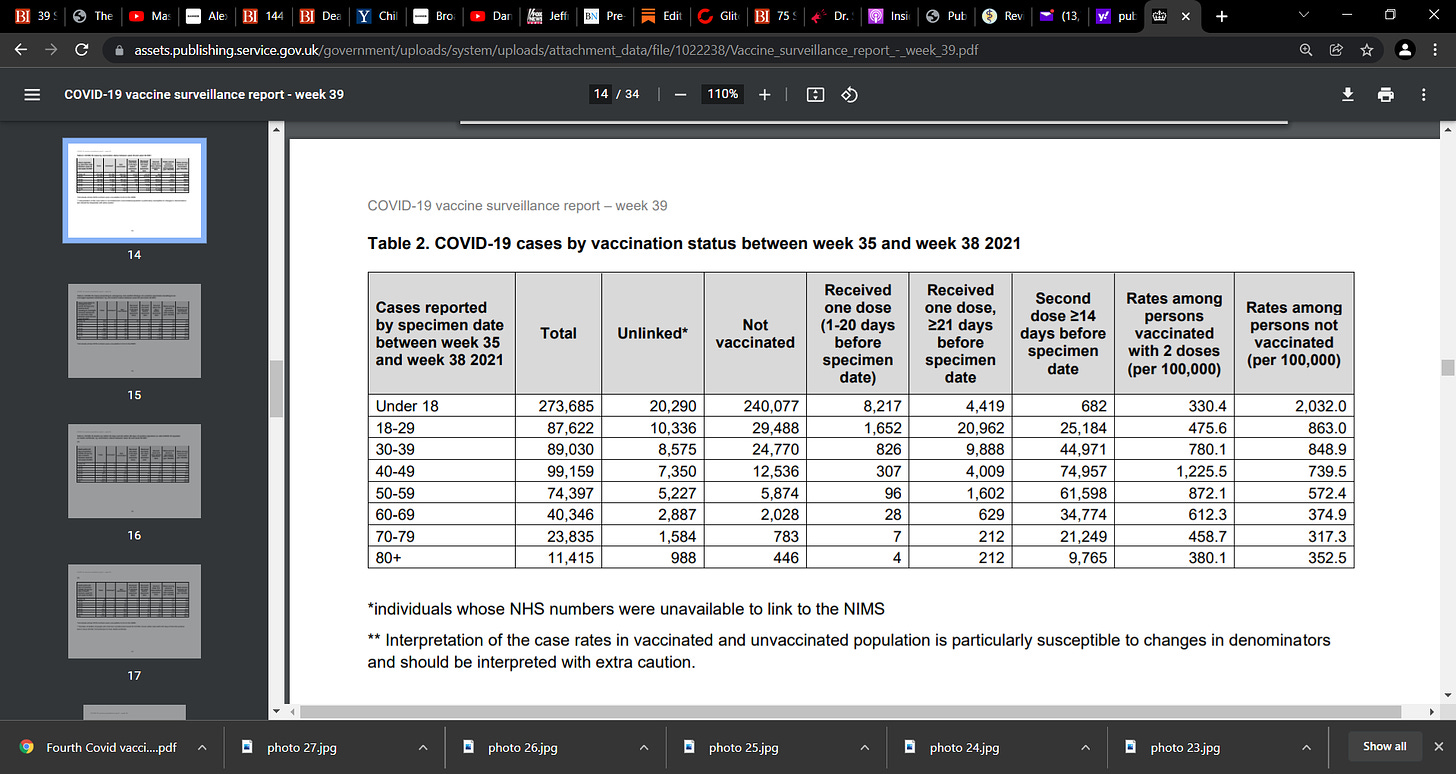
Tables to examine are below (weeks 39 to 51 across the final months of 2021 up to this the first week of 2022) and can you see the explosion of infection in the vaccinated across time as Omicron takes hold? Notice week 50 is where 18-29 the vaccinated get higher than unvaccinated….look closely at 18-29 and see how the rat goes up in the vaccinated across time and switches at week 50, there is a constant increase as more and more are vaccinated…at week 39, ages 30-39 was lower in the vaccinated group and had not yet surpassed the unvaccinated until week 40…you can see the creep towards greater rates in the vaccinated across time, as lower age-groups
End of 2021, to Week 1, 2022
Week 51:
https://assets.publishing.service.gov.uk/government/uploads/system/uploads/attachment_data/file/1041593/Vaccine-surveillance-report-week-50.pdf
Week 50:
https://assets.publishing.service.gov.uk/government/uploads/system/uploads/attachment_data/file/1039677/Vaccine_surveillance_report_-_week_49.pdf
Week 49:
https://assets.publishing.service.gov.uk/government/uploads/system/uploads/attachment_data/file/1037987/Vaccine-surveillance-report-week-48.pdf
Week 48:
https://assets.publishing.service.gov.uk/government/uploads/system/uploads/attachment_data/file/1036047/Vaccine_surveillance_report_-_week_47.pdf
Week 47:
https://assets.publishing.service.gov.uk/government/uploads/system/uploads/attachment_data/file/1034383/Vaccine-surveillance-report-week-46.pdf
Week 46:
https://assets.publishing.service.gov.uk/government/uploads/system/uploads/attachment_data/file/1032859/Vaccine_surveillance_report_-_week_45.pdf
Week 45:
https://assets.publishing.service.gov.uk/government/uploads/system/uploads/attachment_data/file/1032671/Vaccine_surveillance_report_-_week_44.pdf
Week 44:
https://assets.publishing.service.gov.uk/government/uploads/system/uploads/attachment_data/file/1029606/Vaccine-surveillance-report-week-43.pdf
Week 43:
https://assets.publishing.service.gov.uk/government/uploads/system/uploads/attachment_data/file/1027511/Vaccine-surveillance-report-week-42.pdf
Week 42:
https://assets.publishing.service.gov.uk/government/uploads/system/uploads/attachment_data/file/1025358/Vaccine-surveillance-report-week-41.pdf
Week 41:
https://assets.publishing.service.gov.uk/government/uploads/system/uploads/attachment_data/file/1023849/Vaccine_surveillance_report_-_week_40.pdf
Week 40:
https://assets.publishing.service.gov.uk/government/uploads/system/uploads/attachment_data/file/1022238/Vaccine_surveillance_report_-_week_39.pdf
Week 39:
Note, my skills are in evidence based med, clin epi, biostats, research methods etc. I am not a virologist or immunologist. I am trying to understand the insanity we are living to see if I can contribute.


You are my absolute go-to guy for plausible hypotheses. Please keep opining! I hope you find my data useful to support your endeavours. https://metatron.substack.com/p/hugging-your-gran-didnt-kill-her
The iceberg is emerging, we can now see its tip